16 Metrics, Estimation & Risk
Estimation
Project estimation is notoriously difficult to master.
- Why is this such a hard problem?
- What can we do to get better at estimation?
Flaws of human estimation
- Most technical people default to absolute estimation (hours/days), which is flawed due
- Cognitive biases
- Uncertainty inherent in technical projects
Cognitive biases
Optimism Bias: Tendency to be overly optimistic about completion time, underestimating complexity and potential roadblocks
Planning Fallacy: The belief that this project will go faster than previous, similar projects, ignoring historical data
Anchoring: Basing an estimate on the first number mentioned (even if it’s irrelevant), skewing subsequent adjustments
Parkinson’s Law: “Work expands so as to fill the time available for its completion.” If you estimate 5 days, it will take 5 days, even if it could have been 3
Relative estimation
Instead of asking “How long?”, we ask “How big/complex is this relative to that?”
Benefits:
Less Emotional: Easier to agree that one task is bigger than another than to agree on an exact duration
Focus on Complexity: Shifts the focus from time (which is subjective and variable) to complexity, uncertainty, and effort
Team Consensus: Requires the whole team to discuss and align on the size and scope of the work
Story points
Abstract unit of measure used in agile development to estimate the overall effort required to implement a Product Backlog Item (PBI) or user story
Factors represented by story points
Complexity: How intricate is the logic or domain?
Uncertainty: How many unknowns are there? How much research is needed?
Effort/Volume: The sheer amount of work (coding, testing, deployment).
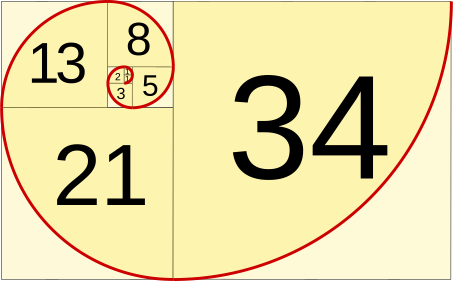
- Fibonacci Sequence (1, 2, 3, 5, 8, 13, 21…) is used to make general, relative estimates
Planning poker
- Consensus-based, relative estimation technique
- Prevents anchoring by forcing simultaneous revelation
- Facilitates healthy debate to uncover hidden complexity
Process:
The Product Owner/Lead reads the story and answers questions
Each team member privately selects a card (Fibonacci number) representing their estimate
Everyone reveals their cards simultaneously
Discussion: If estimates vary widely (e.g. 3 and 13), the high and low estimators briefly explain their rationale (addressing complexity or missed assumptions)
The team re-estimates until consensus is reached
Risk Management
A risk is an uncertain event or condition that, if it occurs, has a positive or negative effect on a project’s objectives (cost, scope, schedule, quality)
Identifying and assessing project risks
Identification: Brainstorming potential risks across common categories
Technical Risks: Unproven technology, integration issues, unexpected performance bottlenecks
Schedule Risks: Over-optimistic estimates, dependencies on third parties, slow team ramp-up
Resource Risks: Loss of a key team member, lack of necessary skills, competing priorities
External Risks: Regulatory changes, vendor failure, market shifts
Assessment (P x I): Evaluate each risk using a simple matrix
Probability (P): How likely is the risk to occur (e.g. Low, Medium, High)?
Impact (I): How severe is the consequence if the risk occurs (e.g. Low, Medium, High)?
Risk Score = Probability x Impact
Creating mitigation plans
For every significant risk, a proactive response plan is mandatory:
| Strategy | Description | Example |
|---|---|---|
| Transfer | Shift the financial consequence/responsibility to a third party | Buying insurance; outsourcing the risky component to a specialist vendor |
| Avoid | Eliminate the threat entirely by changing the project plan or scope | Removing a feature that relies on an unproven API |
| Mitigate | Modify the probability or the impact of the risk through proactive action | Investing in early proof-of-concept (PoC) to reduce technical uncertainty |
| Accept | Acknowledge the risk, but take no action. Used for low PxI risks | Budgeting for potential overtime, or simply setting aside contingency time/money |
Risk register
The risk register is a centralized document/log that contains all identified risks, their assessment, and their planned response. It includes:
ID: Unique identifier
Risk Description: “If X happens, then Y consequence will occur”
P x I Score: Current probability and impact rating

Risk Owner: The person responsible for monitoring the risk and executing the response
Strategy: Avoid, Transfer, Mitigate, Accept
Mitigation Action: The specific steps taken or planned
Status: Open, Watching, Closed, Triggered
Agile Metrics and Tracking Progress
Defining “Done” and moving beyond “Is it done yet?”
A lack of clear definition leads to constant status checks and scope creep
Definition of Done (DoD): A formal, agreed-upon checklist that all PBI/Stories must satisfy before they can be considered complete
The DoD is non-negotiable and provides a single source of truth for completion
Example DoD Items:
Code reviewed and approved
Unit tests passing (e.g. >80% coverage)
Integration tests passing in the staging environment
Non-functional requirements (security, performance) verified
Product Owner accepted and approved
Agile flow metrics (How fast are we moving?)
| Metric | Definition | Relevance |
|---|---|---|
| Lead Time | Time from request (idea generated/put in backlog) to delivery (feature shipped) | Measures overall organizational efficiency and responsiveness to the market |
| Cycle Time | Time from work start (team pulls story from ‘Ready’) to work end (story meets DoD and is shipped) | Measures the efficiency of the team’s engineering process |
| Velocity | Sum of Story Points completed by the team in an iteration/sprint | Measures the capacity of the team. Used for forecasting future capacity, not for performance evaluation |
Progress tracking and forecasting
Velocity: The historical average velocity (e.g. average of the last 3-5 sprints) is the primary input for forecasting.
- Estimated Sprints Remaining = Total remaining Story Points / Average Velocity
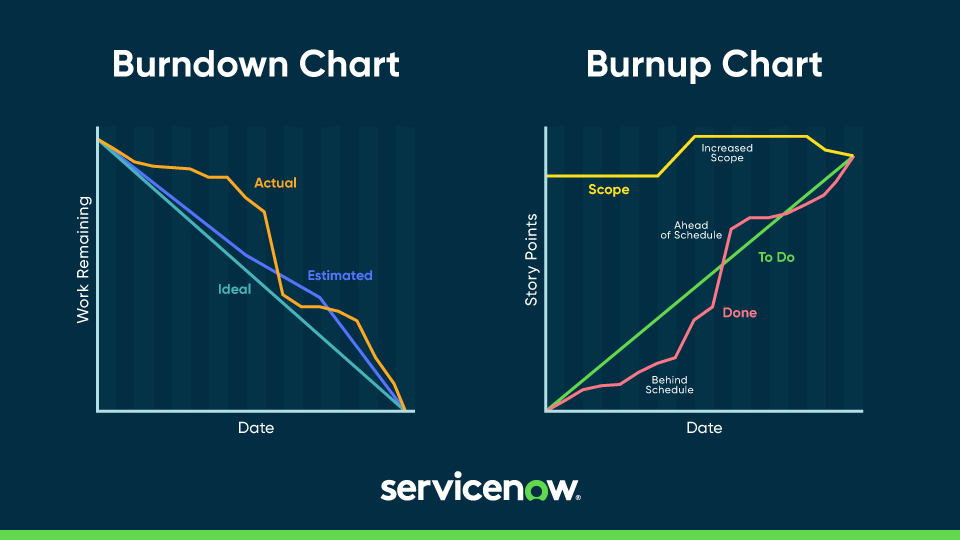
Burndown Chart
Tracks the remaining work over time.
It has an ideal line and an actual line.
X-Axis: Time (Sprints, Weeks)
Y-Axis: Remaining work (Story Points or Tasks)
If the actual line is above the ideal line, the project is likely behind schedule
Burnup Chart
Tracks completed work over time
Also tracks the Total Scope
X-Axis: Time (Sprints, Weeks)
Y-Axis: Total completed work (Story Points)
Helps visualize scope creep (when the total scope line increases) and provides a clearer forecast point where the completed work line intersects the scope line
Summary
Relative estimation (Story Points, Planning Poker)
Structured risk management (P x I, Risk Register)
Agile flow metrics (Cycle Time, Lead Time, Velocity) for tracking and forecasting
Leading technical teams effectively means
Moving away from instinct-based time estimates and reactive problem-solving
Adopting objective, empirical data to drive decisions and manage expectations